Получение прогноза погоды через спутниковый интернет
Алгоритм, сервисы, ссылки, карты.
Технические параметры системы спутникового интернета, которой мы пользуемся, описаны здесь >>
ВНИМАНИЕ: Информация из этой статьи поможет вам сэкономить кучу денег, которую вы могли бы потратить на оплату спутниковой связи. Поэтому после прочтения нажимаем ссылку Paypal.me/TravelyFamily и выражаем щедрую материальную благодарность автору материала :).
Мы вынуждены получать прогноз погоды через спутниковый интернет, если мы вдали от берега больше двух дней.
Что нужно для анализа погоды по маршруту следования?
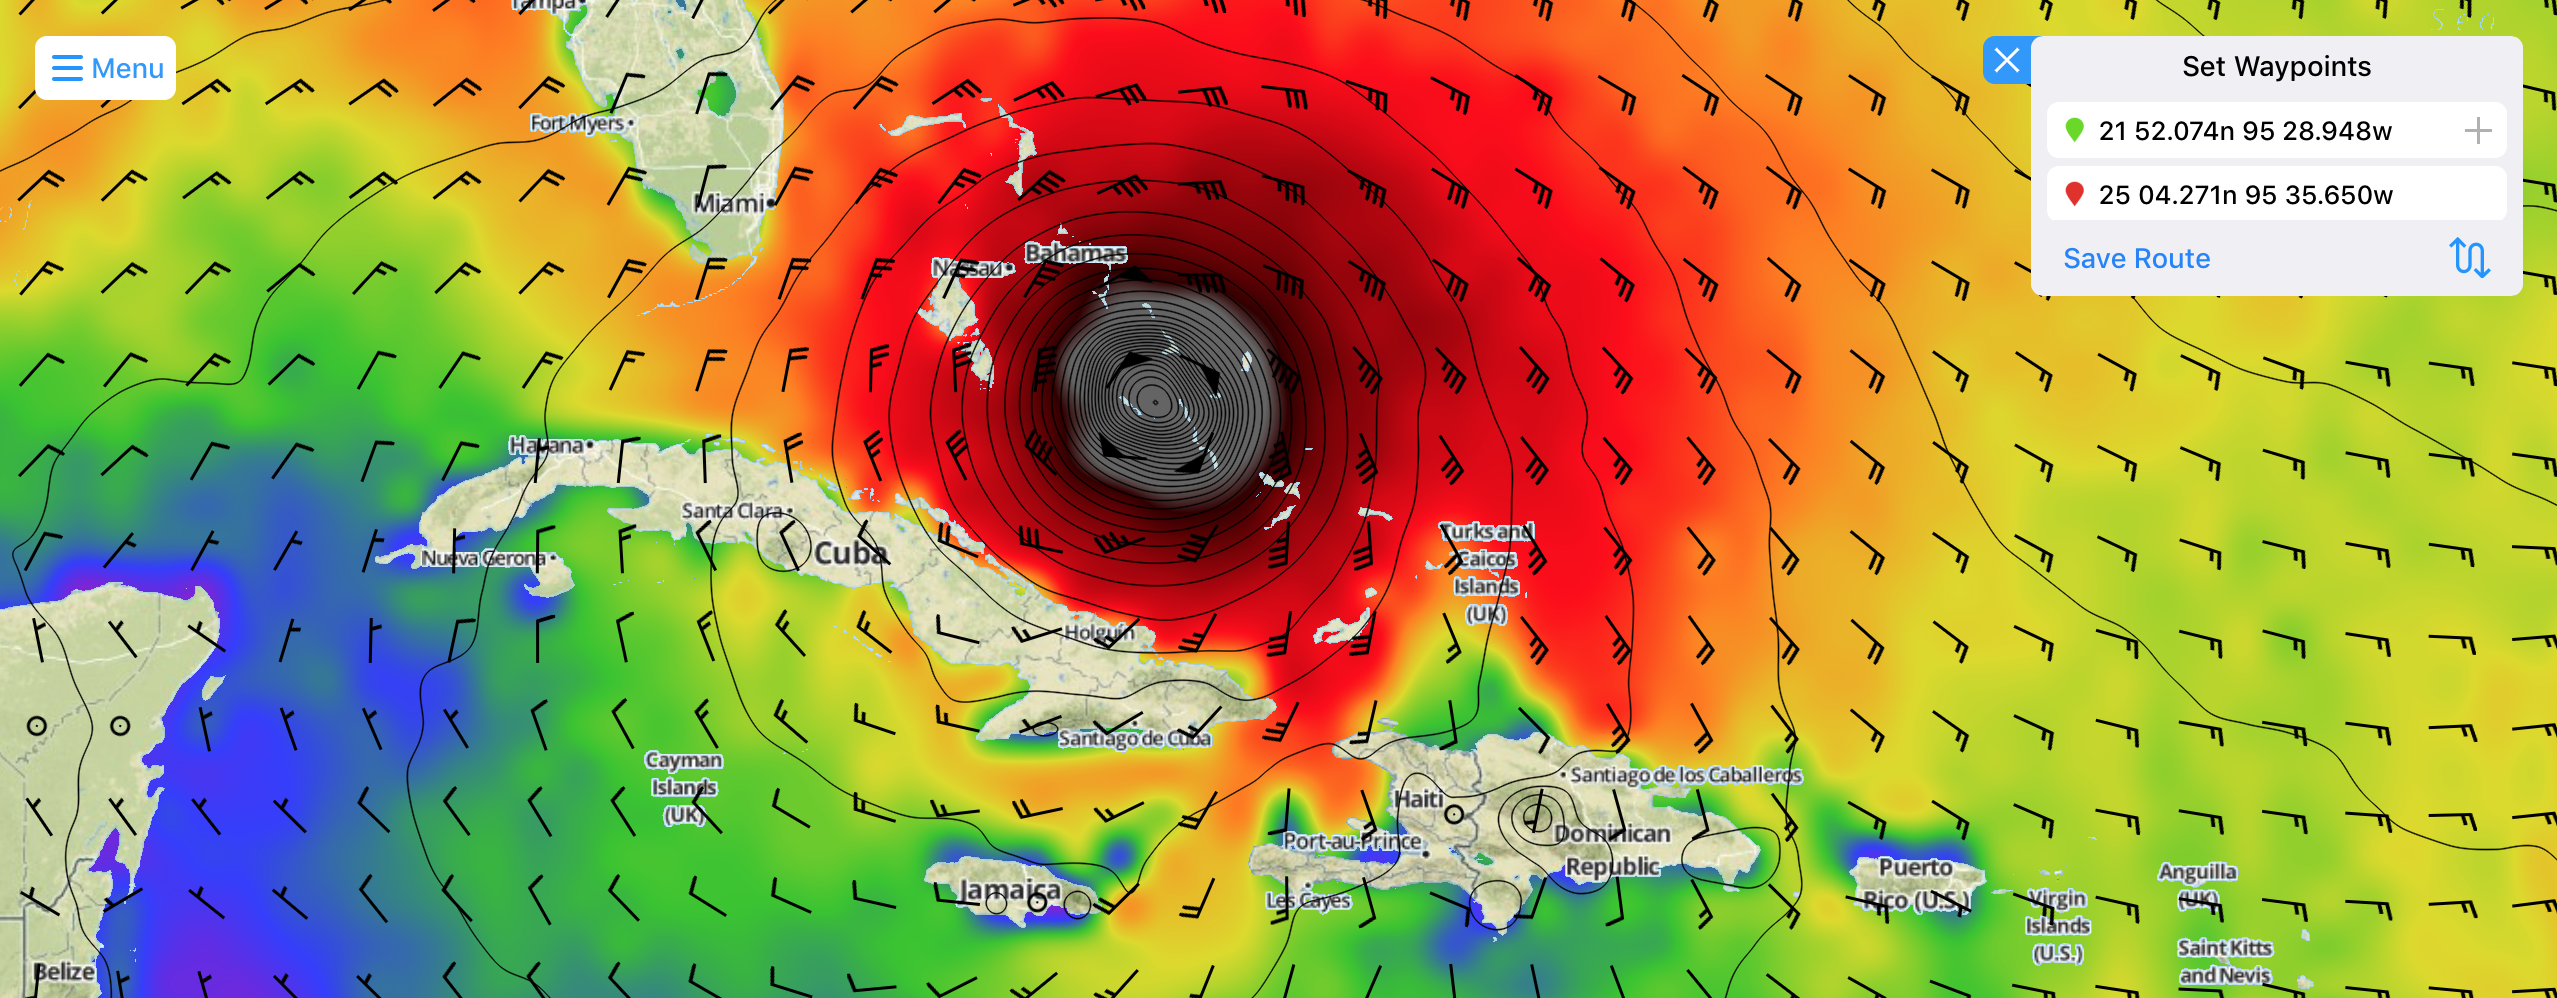
- Погодная карта. Показывает состояние выбранной области в определенный момент (сейчас, через 24, 48, 72 часа)
- Гриб-файл (Grib). Динамика изменения запрошенных параметров (скорость и направление ветра, высота-период-направление волн, изобары и тд).
Получение Grib—файла
пользуемся сервисом Saildocs.
Область — Grib-файл на область ограниченную координатами 3N 2S W90 W82, сетка 0,5 градуса, период 0,6 и так до 72часов.
Параметры — атмосферное давление, скорость и направление ветра, высота и направление волны.
Отправляем e-mail на адрес query@saildocs.com
В теме письма вставляем что угодно, в теле письма пишем следующее:
send gfs:N3,S2,W90,W82|0.5,0.5|0,6..72|PRMSL,WIND,HTSGW,WVDIR
В ответ в течение нескольких минут на емейл, с которого было отправлено письмо, приходит ответное с гриб-файлом.
Получение погодной карты
пользуемся сервисом NOAA.gov
Здесь чуть более сложный текст отправляемого сообщения
На адрес NWS.FTPMail.OPS@noaa.gov отправляем e-mail
В теме письма опять пишем произвольное что-то
В теле письма следующий текст —
Open
Cd fax
Get PYFA90.TIF
Quit
Где PYFA90.TIF — файл необходимой погодной карты.
Возможные карты:
Тихий Океан
These files may be found in directories:
ftp://tgftp.nws.noaa.gov/fax or
//tgftp.nws.noaa.gov/pub/fax
FILE
WIND/WAVE CHARTS — CENTRAL PACIFIC NAME
00Z Pacific Wind/Wave Analysis 30S-30N, 110W-130E PJFB89.TIF
12Z Pacific Wind/Wave Analysis 30S-30N, 110W-130E PJFD89.TIF
Pacific Wind/Wave Analysis (Most Current) PJFB10.TIF
24HR Pacific Wind/Wave Forecast VT00Z 30S-30N, 110W-130E PWFE82.TIF
24HR Pacific Wind/Wave Forecast VT12Z 30S-30N, 110W-130E PWFE84.TIF
24HR Pacific Wind/Wave Forecast (Most Current) PWFE11.TIF
48HR Pacific Wind/Wave Forecast VT00Z 30S-30N, 110W-130E PJFI89.TIF
48HR Pacific Wind/Wave Forecast VT12Z 30S-30N, 110W-130E PJFI91.TIF
48HR Pacific Wind/Wave Forecast (Most Current) PJFI10.TIF
72HR Pacific Sea State Forecast VT00Z 30S-30N, 110W-130E PJFK89.TIF
72HR Pacific Sea State Forecast VT12Z 30S-30N, 110W-130E PJFK91.TIF
72HR Pacific Sea State Forecast (Most Current) PJFK10.TIF
WIND/WAVE CHARTS — SE PACIFIC
Tropical Sea State Analysis VT00Z 20S-30N, E of 145W PKFA88.TIF
Tropical Sea State Analysis VT12Z 20S-30N, E of 145W PKFA89.TIF
Tropical Sea State Analysis (Most Current) PKFA10.TIF
24HR Wind/Wave Forecast VT00Z 20S-30N, E of 145W PWFE01.TIF
24HR Wind/Wave Forecast VT12Z 20S-30N, E of 145W PWFE03.TIF
24HR Wind/Wave Forecast (Most Current) PWFE10.TIF
48HR Wind/Wave Forecast VT00Z 20S-30N, E of 145W PWFI88.TIF
48HR Wind/Wave Forecast VT12Z 20S-30N, E of 145W PWFI90.TIF
48HR Wind/Wave Forecast (Most Current) PWFI10.TIF
@48HR Wave Period/Swell Direction VT00Z 20S-30N, E of 145W PJFI87.TIF
48HR Wave Period/Swell Direction VT12Z 20S-30N, E of 145W PJFI88.TIF
48HR Wave Period/Swell Direction (Most Current) PJFI11.TIF
72HR Wind/Wave Forecast VT00Z 20S-30N, E of 145W PWFK92.TIF
72HR Wind/Wave Forecast VT12Z 20S-30N, E of 145W PWFK93.TIF
72HR Wind/Wave Forecast (Most Current) PWFK10.TIF
72HR Wave Period/Swell Direction VT00Z 20S-30N, E of 145W PJFK93.TIF
WIND/WAVE CHARTS — NORTH PACIFIC
00Z Sea State Analysis 20N-70N, 115W-135E PJBA99.TIF
@00Z Wind/Wave Analysis 18N-62N, E OF 157W PWBA88.TIF
@06Z Wind/Wave Analysis 18N-62N, E OF 157W PWBB88.TIF
@12Z Wind/Wave Analysis 18N-62N, E OF 157W PWBA89.TIF
@18Z Wind/Wave Analysis 18N-62N, E OF 157W PWBD89.TIF
@ Wind/Wave Analysis 18N-62N, E OF 157W (Most Current) PWBA90.TIF
24HR Wind/Wave Forecast VT00Z 18N-62N, E OF 157W PWBE98.TIF
24HR Wind/Wave Forecast VT12Z 18N-62N, E OF 157W PWBE99.TIF
24HR Wind/Wave Forecast (Most Current) PWBE10.TIF
48HR Wind/Wave Forecast VT00Z 20N-70N, 115W-135E PJBI98.TIF
48HR Wind/Wave Forecast VT12Z 20N-70N, 115W-135E PJBI99.TIF
48HR Wind Wave Forecast (Most Current) PJBI10.TIF
48HR Wave Period/Swell Direction VT00Z 20N-70N, 115W-135E PJBI88.TIF
@48HR Wave Period/Swell Direction VT12Z 20N-70N, 115W-135E PJBI89.TIF
48HR Wave Period/Swell Direction (Most Current) PJBI20.TIF
96HR Wind/Wave Forecast VT12Z 20N-70N, 115W-135E PJBM98.TIF
96HR Wave Period/Swell Direction VT12Z 20N-70N, 115W-135E PJBM88.TIF
SURFACE CHARTS — CENTRAL PACIFIC
@00Z North Pacific Preliminary Analysis 20N-80N, 110W-110E xxxxxx.TIF
@06Z North Pacific Preliminary Analysis 20N-80N, 110W-110E xxxxxx.TIF
@12Z North Pacific Preliminary Analysis 20N-80N, 110W-110E xxxxxx.TIF
@18Z North Pacific Preliminary Analysis 20N-80N, 110W-110E xxxxxx.TIF
@ North Pacific Preliminary Analysis (Most Current) PYPA00.TIF
00Z Pacific Surface Analysis EQ-50N, 110W-130E PPBA88.TIF
06Z Pacific Surface Analysis EQ-50N, 110W-130E PPBA89.TIF
12Z Pacific Surface Analysis EQ-50N, 110W-130E PPBA90.TIF
18Z Pacific Surface Analysis EQ-50N, 110W-130E PPBA91.TIF
Pacific Surface Analysis (Most Current) PPBA11.TIF
00Z Pacific Streamline Analysis 30S-30N, 110W-130E PWFA90.TIF
06Z Pacific Streamline Analysis 30S-30N, 110W-130E PWFA91.TIF
12Z Pacific Streamline Analysis 30S-30N, 110W-130E PWFA92.TIF
18Z Pacific Streamline Analysis 30S-30N, 110W-130E PWFA93.TIF
Pacific Streamline Analysis (Most Current) PWFA11.TIF
@$00Z Tropical Surface Analysis 40S-40N, 100W-120E xxxxxx.TIF
@$06Z Tropical Surface Analysis 40S-40N, 100W-120E xxxxxx.TIF
@$12Z Tropical Surface Analysis 40S-40N, 100W-120E xxxxxx.TIF
@$18Z Tropical Surface Analysis 40S-40N, 100W-120E xxxxxx.TIF
@$ Tropical Surface Analysis (Most Current) QYFA99.TIF
03Z Significant Cloud Features 30S-50N, 110W-160E PBFA99.TIF
15Z Significant Cloud Features 30S-50N, 110W-160E PBFC99.TIF
Significant Cloud Features (Most Current) PBFA11.TIF
24HR Pacific Surface Forecast VT00Z 30S-50N 110W-130E PYFE87.TIF
24HR Pacific Surface Forecast VT12Z 30S-50N 110W-130E PYFE88.TIF
24HR Pacific Surface Forecast (Most Current) PYFE11.TIF
@$24HR Wind/Stream Forecast VT00Z 30S-50N, 100W-120E QWFI99.TIF
@$48HR Wind/Stream Forecast VT00Z 30S-50N, 100W-120E QWFQ99.TIF
48HR Pacific Surface Forecast VT00Z 30S-50N 110W-130E PYFI87.TIF
48HR Pacific Surface Forecast VT12Z 30S-50N 110W-130E PYFI88.TIF
48HR Pacific Surface Forecast (Most Current) PYFI11.TIF
72HR Pacific Surface Forecast VT00Z 30S-50N 110W-130E PYFK87.TIF
72HR Pacific Surface Forecast VT12Z 30S-50N 110W-130E PYFK88.TIF
72HR Pacific Surface Forecast (Most Current) PYFK11.TIF
$ These charts will no longer be available sometime after June 20, 2006
SURFACE CHARTS — SE PACIFIC
00Z East Pacific Surface Analysis 20S-30N, E of 145W PYFA96.TIF
06Z East Pacific Surface Analysis 20S-30N, E of 145W PYFA97.TIF
12Z East Pacific Surface Analysis 20S-30N, E of 145W PYFA98.TIF
18Z East Pacific Surface Analysis 20S-30N, E of 145W PYFA99.TIF
East Pacific Surface Analysis Most Current PYFA90.TIF
@00Z U.S./Tropical Surface Analysis 5S-50N,55W-125W PYEB86.TIF
@06Z U.S./Tropical Surface Analysis 5S-50N,55W-125W PYEB87.TIF
@12Z U.S./Tropical Surface Analysis 5S-50N,55W-125W PYEB85.TIF
@18Z U.S./Tropical Surface Analysis 5S-50N,55W-125W PYEB88.TIF
@ U.S./Tropical Surface Analysis 5S-50N,55W-125W PYEB11.TIF
24HR Tropical Surface Forecast VT00 20S-30N, E of 145W PYFE79.TIF
24HR Tropical Surface Forecast VT12 20S-30N, E of 145W PYFE80.TIF
24HR Tropical Surface Forecast(Most Current) PYFE10.TIF
48HR Tropical Surface Forecast VT00 20S-30N, E of 145W PYFI81.TIF
48HR Tropical Surface Forecast VT12 20S-30N, E of 145W PYFI82.TIF
48HR Tropical Surface Forecast(Most Current) PYFI10.TIF
72HR Tropical Surface Forecast VT00 20S-30N, E of 145W PYFK83.TIF
72HR Tropical Surface Forecast VT12 20S-30N, E of 145W PYFK84.TIF
72HR Tropical Surface Forecast (Most Current) PYFK10.TIF
SURFACE CHARTS — NORTH PACIFIC
00Z Surface Analysis NE Pacific (Part 1) 20N-70W, 115W-175W PYBA01.TIF
00Z Surface Analysis NW Pacific (Part 2) 20N-70W, 175W-135E PYBA02.TIF
06Z Surface Analysis NE Pacific (Part 1) 20N-70W, 115W-175W PYBA03.TIF
06Z Surface Analysis NW Pacific (Part 2) 20N-70W, 175W-135E PYBA04.TIF
12Z Surface Analysis NE Pacific (Part 1) 20N-70W, 115W-175W PYBA05.TIF
12Z Surface Analysis NW Pacific (Part 2) 20N-70W, 175W-135E PYBA06.TIF
18Z Surface Analysis NE Pacific (Part 1) 20N-70W, 115W-175W PYBA07.TIF
18Z Surface Analysis NW Pacific (Part 2) 20N-70W, 175W-135E PYBA08.TIF
Surface Analysis, Part 1 (Most Current) PYBA90.TIF
Surface Analysis, Part 2 (Most Current) PYBA91.TIF
@24HR Surface Forecast VT00Z 18N-62W, E of 157W PPBE00.TIF
@24HR Surface Forecast VT12Z 18N-62W, E of 157W PPBE01.TIF
@24HR Surface Forecast (Most Current) PPBE10.TIF
48HR Surface Forecast VT00Z 20N-70W, 115W-135E PWBI98.TIF
48HR Surface Forecast VT12Z 20N-70W, 115W-135E PWBI99.TIF
48HR Surface Forecast (Most Current) PWBI10.TIF
96HR Surface Forecast VT12Z 20N-70W, 115W-135E PWBM99.TIF
TROPICAL CYCLONE CHARTS — PACIFIC
72 HR Tropical Cyclone Danger Area VT 03Z 0N-40N, 80W-170E PWFK03.TIF
72 HR Tropical Cyclone Danger Area VT 09Z 0N-40N, 80W-170E PWFK09.TIF
72 HR Tropical Cyclone Danger Area VT 15Z 0N-40N, 80W-170E PWFK15.TIF
72 HR Tropical Cyclone Danger Area VT 21Z 0N-40N, 80W-170E PWFK21.TIF
72 HR Tropical Cyclone Danger Area (Most Current) PWFK12.TIF
SEA SURFACE TEMPERATURE CHARTS
Pacific SST Chart 55N-EQ, 110W-160E PTFA88.TIF
SATELLITE IMAGERY (IR)
00Z Eastern Pacific Satellite Image 05S-55N, 110W-155E evpz00.jpg
06Z Eastern Pacific Satellite Image 05S-55N, 110W-155E evpz06.jpg
12Z Eastern Pacific Satellite Image 05S-55N, 110W-155E evpz12.jpg
18Z Eastern Pacific Satellite Image 05S-55N, 110W-155E evpz18.jpg
Eastern Pacific Satellite Image (Most Current) evpz11.jpg
00Z Southwest Pacific Satellite Image 40S-05N, 130W-165E evps00.jpg
06Z Southwest Pacific Satellite Image 40S-05N, 130W-165E evps06.jpg
12Z Southwest Pacific Satellite Image 40S-05N, 130W-165E evps12.jpg
18Z Southwest Pacific Satellite Image 40S-05N, 130W-165E evps18.jpg
Southwest Pacific Satellite Image (Most Current) evps11.jpg
@00Z Tropical East Pacific Satellite Image 20S-40N,E of 145W evpn02.jpg
06Z Tropical East Pacific Satellite Image 20S-40N,E of 145W evpn07.jpg
@12Z Tropical East Pacific Satellite Image 20S-40N,E of 145W evpn04.jpg
18Z Tropical East Pacific Satellite Image 20S-40N,E of 145W evpn08.jpg
Tropical East Pacific Satellite Image (MOST CURRENT) evpn10.jpg
@00Z Pacific Satellite Image 05N-55N, E of 180W evpn01.jpg
06Z Pacific Satellite Image 05N-55N, E of 180W evpn06.jpg
@12Z Pacific Satellite Image 05N-55N, E of 180W evpn12.jpg
18Z Pacific Satellite Image 05N-55N, E of 180W evpn18.jpg
Pacific Satellite Image (MOST CURRENT) evpn99.jpg
SCHEDULE INFORMATION
Radiofax Schedule (Honolulu, HI) Part I PLBZ07.TIF
Radiofax Schedule (Honolulu, HI) Part II PLBZ09.TIF
Radiofax Schedule (DOS Text Version) hfhi.txt
Test/Map Symbols/General Notice PLBZ08.TIF
Internet File Names (This file) rfaxhi.txt
@ Not transmitted via Honolulu radiofax but listed here for convenience
Many of these charts also broadcast from Pt. Reyes, CA and Kodiak, AK
If you have access to the World Wide Web be certain to check out
the following webpages. See these pages for further links.
//www.nws.noaa.gov NWS Homepage
//www.nws.noaa.gov/om/marine/home.htm NWS Marine Page
cell.weather.gov Cellphone page
mobile.weather.gov Mobile Page
Author: Marine, Tropical, and Tsunami Services Branch, W/AFS26
National Weather Service
Feedback or questions: marine.weather@noaa.gov
Last Modified Dec 12, 2014
Document URL: //tgftp.nws.noaa.gov/fax/rfaxhi.txt
ftp://tgftp.nws.noaa.gov/fax/rfaxhi.txt</pre>
Атлантический Океан
These files may be found in directories:
ftp://tgftp.nws.noaa.gov/fax or
FILE
WIND/SEAS CHARTS NAME
12Z Sea State Analysis, 10E-95W Northern Hemisphere PJAA99.TIF
00Z Wind/Wave Analysis, 40W-98W Northern Hemisphere PWAA88.TIF
06Z Wind/Wave Analysis, 40W-98W Northern Hemisphere PWAB88.TIF
12Z Wind/Wave Analysis, 40W-98W Northern Hemisphere PWAA89.TIF
18Z Wind/Wave Analysis, 40W-98W Northern Hemisphere PWAD89.TIF
Wind/Wave Analysis, (Most Current) PWAA90.TIF
24HR Wind/Wave Chart VT00Z Forecast 40W-98W N. Hemisphere PWAE98.TIF
24HR Wind/Wave Chart VT12Z Forecast 40W-98W N. Hemisphere PWAE99.TIF
24HR Wind/Wave Chart Forecast (Most Current) PWAE10.TIF
48HR Wind/Wave VT00Z Forecast 10E-95W Northern Hemisphere PJAI98.TIF
48HR Wind/Wave VT12Z Forecast 10E-95W Northern Hemisphere PJAI99.TIF
48HR Wind/Wave Chart Forecast (Most Current) PJAI10.TIF
48HR Wave Period VT00Z Forecast 10E-95W Northern Hemisphere PJAI88.TIF
48HR Wave Period VT12Z Forecast 10E-95W Northern Hemisphere PJAI89.TIF
48HR Wave Period Chart Forecast (Most Current) PJAI20.TIF
72HR 12Z North Atlantic 72 hour Wind/Wave Forecast PJAK88.TIF
96HR Wind/Wave Chart VT12Z Forecast 10E-95W N. Hemisphere PJAM98.TIF
96HR Wave Period VT12Z Forecast 10E-95W N. Hemisphere PJAM88.TIF
SURFACE CHARTS
00Z Preliminary Surface Chart Analysis 45W-85W N. Hemisphere PYAA10.TIF
06Z Preliminary Surface Chart Analysis 45W-85W N. Hemisphere PYAB01.TIF
12Z Preliminary Surface Chart Analysis 45W-85W N. Hemisphere PYAC01.TIF
18Z Preliminary Surface Chart Analysis 45W-85W N. Hemisphere PYAD01.TIF
Preliminary Surface Chart Analysis (Most Current) PYAD10.TIF
00Z Surface Analysis Chart, Part 1, 10E-45W N. Hemisphere PYAA01.TIF
00Z Surface Analysis Chart, Part 2, 40W-95W N. Hemisphere PYAA02.TIF
06Z Surface Analysis Chart, Part 1, 10E-45W N. Hemisphere PYAA03.TIF
06Z Surface Analysis Chart, Part 2, 40W-95W N. Hemisphere PYAA04.TIF
12Z Surface Analysis Chart, Part 1, 10E-45W N. Hemisphere PYAA05.TIF
12Z Surface Analysis Chart, Part 2, 40W-95W N. Hemisphere PYAA06.TIF
18Z Surface Analysis Chart, Part 1, 10E-45W N. Hemisphere PYAA07.TIF
18Z Surface Analysis Chart, Part 2, 40W-95W N. Hemisphere PYAA08.TIF
Surface Analysis Chart, Part 1, (Most Current) PYAA11.TIF
Surface Analysis Chart, Part 2, (Most Current) PYAA12.TIF
24HR Surface Chart VT00Z Forecast 40W-98W Northern Hemisphere PPAE00.TIF
24HR Surface Chart VT12Z Forecast 40W-98W Northern Hemisphere PPAE01.TIF
24HR Surface Chart Forecast (Most Current) PPAE10.TIF
48HR Surface Chart VT00Z Forecast 10E-95W Northern Hemisphere QDTM85.TIF
48HR Surface Chart VT12Z Forecast 10E-95W Northern Hemisphere QDTM86.TIF
48HR Surface Chart Forecast (Most Current) QDTM10.TIF
72HR 12Z North Atlantic 72 hour Surface Forecast PPAK98.TIF
96HR Surface Chart VT12Z Forecast 10E-95W Northern Hemisphere PWAM99.TIF
UPPER AIR CHARTS
00Z 500MB Surface Chart Analysis 10E-95W Northern Hemisphere PPAA50.TIF
12Z 500MB Surface Chart Analysis 10E-95W Northern Hemisphere PPAA51.TIF
500MB Surface Chart Analysis (Most Current) PPAA10.TIF
24HR 500MB Chart VT00Z Forecast 10E-95W Northern Hemisphere PPAE50.TIF
24HR 500MB Chart VT12Z Forecast 10E-95W Northern Hemisphere PPAE51.TIF
24HR 500MB Chart Forecast (Most Current) PPAE11.TIF
36HR 500MB Chart VT00Z Forecast 10E-95W Northern Hemisphere PPAG51.TIF
36HR 500MB Chart VT12Z Forecast 10E-95W Northern Hemisphere PPAG50.TIF
36HR 500MB Chart Forecast (Most Current) PPAG11.TIF
48HR 500MB Chart VT00Z Forecast 10E-95W Northern Hemisphere PPAI50.TIF
48HR 500MB Chart VT12Z Forecast 10E-95W Northern Hemisphere PPAI51.TIF
48HR 500MB Chart Forecast (Most Current) PPAI10.TIF
96HR 500MB Chart VT12Z Forecast 10E-95W Northern Hemisphere PPAM50.TIF
TROPICAL CYCLONE CHARTS
Tropical Cyclone Danger Area* VT03, 05N-60N, 00W-100W PWEK89.TIF
Tropical Cyclone Danger Area* VT09, 05N-60N, 00W-100W PWEK90.TIF
Tropical Cyclone Danger Area* VT15, 05N-60N, 00W-100W PWEK91.TIF
Tropical Cyclone Danger Area* VT21, 05N-60N, 00W-100W PWEK88.TIF
Tropical Cyclone Danger Area* (Most Current) PWEK11.TIF
SATELLITE IMAGERY
00Z GOES IR Satellite Image, West Atlantic evnt00.jpg
06Z GOES IR Satellite Image, Atlantic evnt06.jpg
12Z GOES IR Satellite Image, West Atlantic evnt12.jpg
18Z GOES IR Satellite Image, Atlantic evnt18.jpg
W Atlantic or Atlantic (Most Current) evnt99.jpg
ICE CHARTS
Ice Chart from U.S. Coast Guard International Ice Patrol PIEA88.TIF
(During Ice Season only ~Feb-Sep, for further information see:
//www.uscg.mil/lantarea/iip/home.html)
SCHEDULE INFORMATION
Radiofax Schedule Part 1 (Boston, MA) PLAZ01.TIF
Radiofax Schedule Part 2 (Boston, MA) PLAZ02.TIF
Radiofax Schedule (DOS Text Version) hfmarsh.txt
Request for Comments PLAZ03.TIF
Product Notice Bulletin PLAZ04.TIF
Test Pattern PZZZ94.TIF
Internet File Names (This file) rfaxatl.txt
* Tropical Cyclone Danger Area chart replaced by 48HR High Wind/Wave Warning
chart Dec 01 — May 14 Valid times 00z,06z,12z and 18z, Map area 05N-40N, 35W-100W
Tropical cyclone charts also broadcast from New Orleans, LA
If you have access to the World Wide Web be certain to check out
the following webpages. See these pages for further links.
//www.nws.noaa.gov NWS Homepage
//www.nws.noaa.gov/om/marine/home.htm NWS Marine Page
cell.weather.gov Cellphone page
mobile.weather.gov Mobile Page
Author: Marine, Tropical, and Tsunami Services Branch, W/AFS26
National Weather Service
Feedback or questions: marine.weather@noaa.gov
Last Modified Dec 12, 2014
Document URL: //tgftp.nws.noaa.gov/fax/rfaxatl.txt
ftp://tgftp.nws.noaa.gov/fax/rfaxatl.txt
Для получения более подробной инструкции по работе с сервисом Saildocs или Noaa.gov отправляем на вышеуказанные e-mail письмо с текстом help


Комментарии: